Red Hat CodeReady Containers brings a minimal pre-configured Openshift cluster (version 4.1 or higher) to your server or desktop, as long as it has the necessary capacity to host the cluster. As far as I’m concerned, the hardware prerequisites announced by RedHat were sufficient for the installation of CRC only, but it started to get greedy when I wanted to install other tools behind it. For this REX, I’m going to use a lightweight application.
Feedback
Deploy an Openshift or OKD cluster to test the containers we’ll be deploying on it. In this case, it’ll be a Trivy operator + a Nginx POD.
Having it deployed on a Debian could help those who want to get started to avoid any of the problems I’ve encountered.
Note
RedHat recommends using a RedHat or RedHat-like distribution, such as CentOS or Rocky Linux. Since I’m more of a Debian guy, I thought I’d give it a try on my everyday distribution 😄
Check that port 80 and 443 on the server you are deploying to are not already being listened to by another application, such as Nginx, Apache2, HAProxy, etc.
I’ve started installing the packages needed to deploy CRC
Download CRC binary on redhat.com https://developers.redhat.com/products/openshift-local/overview. We need to click on “Install Openshift on your laptop” and then choos Linux OS Linux, then click on Download Openshift Local. Extract the archive and copy the crc bin on /usr/local/bin (need this path to be on $PATH environment variable)
Download of pull secret
Config, start and debug of CRC, 2 ways:
Config and classic startup:
1
2
3
4
5
6
7
crc config set network-mode user
crc setup
crc start -c 8 -m 12000 -p pull-secret --log-level debug
crc status
crc ip
oc login -u kubeadmin -p <password> https://api.crc.testing:6443
oc projects
Config, startup and Debug from the deployed VM:
Note
Normally, we don’t need to connect to our VM, but if we need to, we can do so to diagnose and debug in more detail.
1
2
3
4
5
6
7
8
9
10
11
12
crc config set network-mode user
crc setup
crc start -c 8 -m 12000 -p pull-secret --log-level debug
crc status
crc ip
ssh -i ~/.crc/machines/crc/id_ecdsa -o StrictHostKeyChecking=no -o UserKnownHostsFile=/dev/null  core@192.168.130.11
crc console --credentials
oc login -u kubeadmin -p <password> https://api.crc.testing:6443
oc projects
oc get pods -A
oc get co
crictl ps
Commands explanation:
crc config set network-mode user: I use the user mode as CRC network mode, which allows me to use the 127.0.0.1 ip instead of the CRC default ip (which is 192.168.130.11). Otherwise it didn’t work on my side, I couldn’t find out why, maybe it was my iptables rules, but I’m not sure…
-c 8 -m 12000: I specify 8 vCPUs and 12 GB RAM to be set on the virtua machine
-p pull-secret: I specify the pull-secret file to be taken into account because to be able to launch CRC, it is necessary to have a valid Openshift user and to fill it in.
–log-level debug: I ask for an output log level in debug mode. Be careful, it’s very verbose, and you mustn’t take into account every “error” you see, as it often concerns the time it takes to wait (timeo ut) for the step in question to finish.
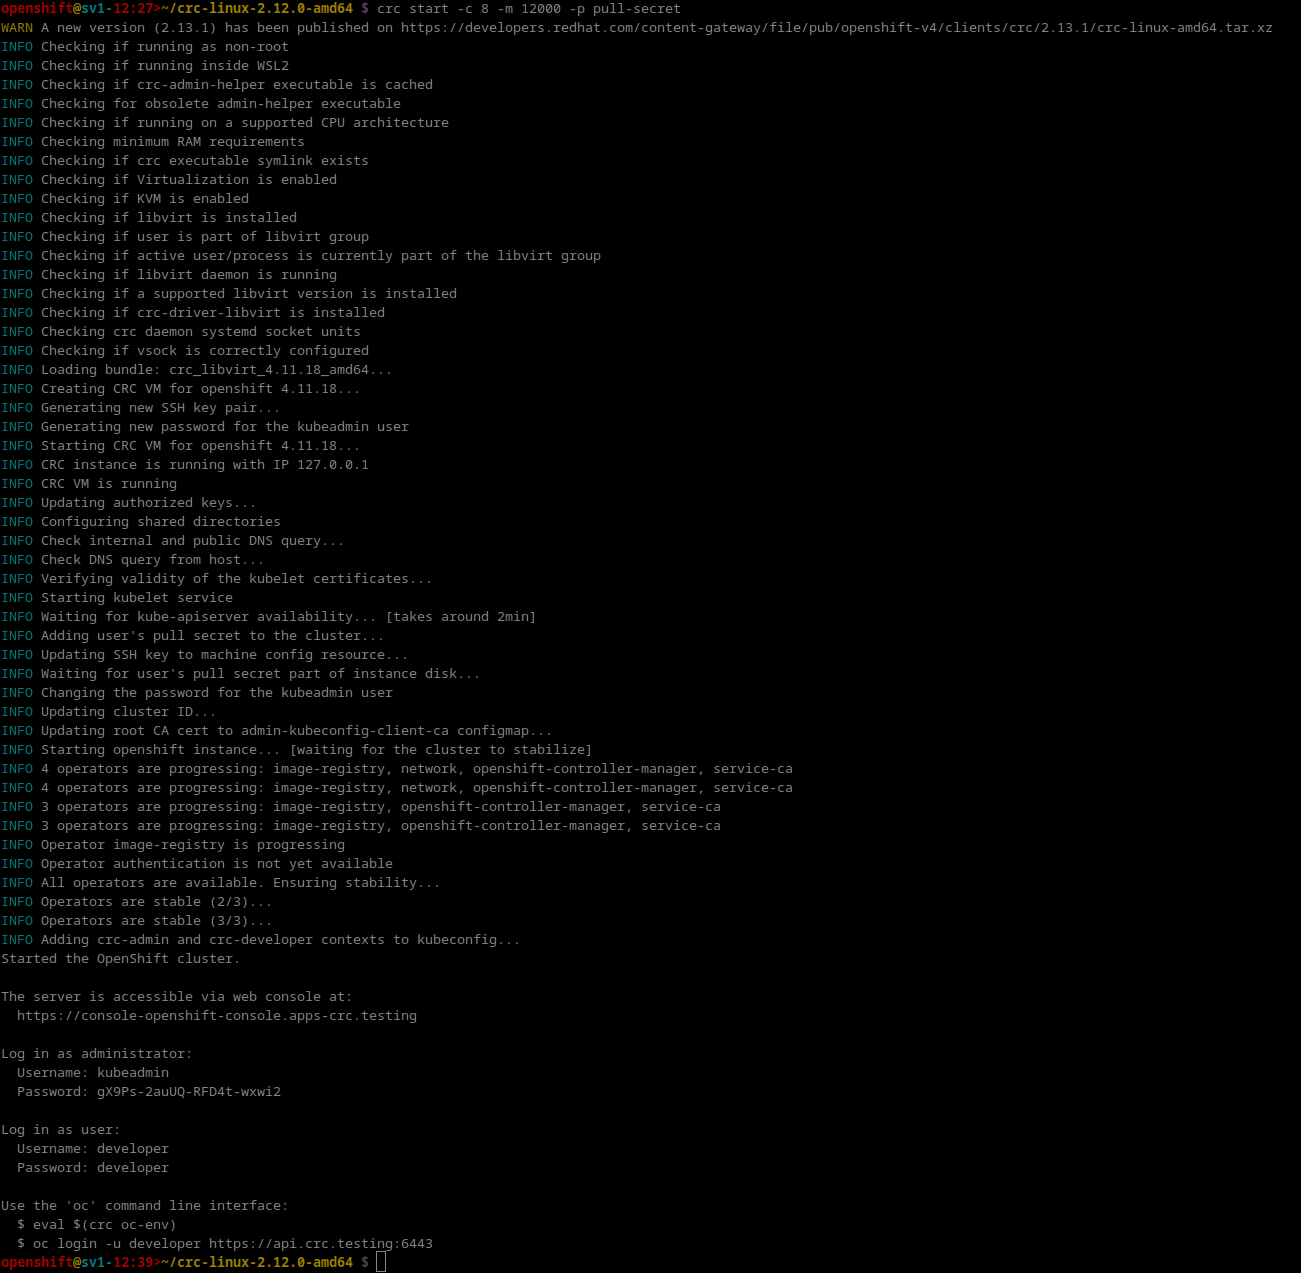
crc start
If our crc start command completes successfully, we can see the link to our Openshift interface. We also see the credentials to connect to our Openshift API via the oc or kubectl command.
crc status: Checking cluster status
1
2
3
4
5
6
7
openshift@sv1-12:20>~ $ crc status
CRC VM: Running
OpenShift: Running (v4.11.18)RAM Usage: 7.549GB of 12.27GB
Disk Usage: 15.48GB of 32.74GB (Inside the CRC VM)Cache Usage: 16.18GB
Cache Directory: /home/openshift/.crc/cache
crc console –credentials: this command tells us how to connect to our cluster via the command-line OC with two user types (kubeadmin or developer)
1
2
3
openshift@sv1-12:24>~ $ crc console --credentials
To login as a regular user, run 'oc login -u developer -p developer https://api.crc.testing:6443'.
To login as an admin, run 'oc login -u kubeadmin -p gX9Ps-2auUQ-RFD4t-wxwi2 https://api.crc.testing:6443'
openshift@sv1-12:24>~ $ oc login -u kubeadmin -p gX9Ps-2auUQ-RFD4t-wxwi2 https://api.crc.testing:6443
Login successful.
You have access to 67 projects, the list has been suppressed. You can list all projects with 'oc projects'Using project "default".
openshift@sv1-10:30>~ $ oc projects
You have access to the following projects and can switch between them with 'oc project <projectname>':
* default
hostpath-provisioner
kube-node-lease
kube-public
kube-system
openshift
openshift-apiserver
openshift-apiserver-operator
openshift-authentication
openshift-authentication-operator
openshift-cloud-controller-manager
openshift-cloud-controller-manager-operator
openshift-cloud-credential-operator
openshift-cloud-network-config-controller
openshift-cluster-csi-drivers
openshift-cluster-machine-approver
openshift-cluster-node-tuning-operator
openshift-cluster-samples-operator
openshift-cluster-storage-operator
openshift-cluster-version
openshift-config
openshift-config-managed
openshift-config-operator
openshift-console
openshift-console-operator
openshift-console-user-settings
openshift-controller-manager
openshift-controller-manager-operator
openshift-dns
openshift-dns-operator
openshift-etcd
openshift-etcd-operator
openshift-host-network
openshift-image-registry
openshift-infra
openshift-ingress
openshift-ingress-canary
openshift-ingress-operator
openshift-insights
openshift-kni-infra
openshift-kube-apiserver
openshift-kube-apiserver-operator
openshift-kube-controller-manager
openshift-kube-controller-manager-operator
openshift-kube-scheduler
openshift-kube-scheduler-operator
openshift-kube-storage-version-migrator-operator
openshift-machine-api
openshift-machine-config-operator
openshift-marketplace
openshift-monitoring
openshift-multus
openshift-network-diagnostics
openshift-network-operator
openshift-node
openshift-nutanix-infra
openshift-oauth-apiserver
openshift-openstack-infra
openshift-operator-lifecycle-manager
openshift-operators
openshift-ovirt-infra
openshift-route-controller-manager
openshift-sdn
openshift-service-ca
openshift-service-ca-operator
openshift-user-workload-monitoring
openshift-vsphere-infra
Using project "default" on server "https://api.crc.testing:6443".
debug inside VM:
Using GUI Openshift
Redirection
When CRC is deployed, we can see that our machine now listens on ports 80, 443 and 6443. Since our Openshift cluster’s pre-configured DNS is not publicly declared, to access the console in GUI mode I have to modify the /etc/hosts file on my local PC to redirect our DNS request to my remote machine, so I enter the latter’s public IP.
1
2
vim /etc/hosts
<ip-publique> console-openshift-console.apps-crc.testing oauth-openshift.apps-crc.testing
Note
In this case, I enter the public IP because my machine is remote, but it could have been its private IP if I’d tried to access this console from another machine on the same network.
Operator Accessing and Deployment
I access my console via my browser using this URL https://console-openshift-console.apps-crc.testing, which redirects me to the second authentication URL I’ve entered in my /etc/hosts, and I use my admin credentials:
Home page:
I click on OperatorHub in the left-hand menu, search for Trivy as the operator to install and install it:
Once installed, I can check in Installed Operators and click on my component for more details:
Utilisation de Trivy
Trivy is OpenSource software that scans OS or IaC (Infrastructure-as-Code) configurations for potential vulnerabilities. Operation is relatively straightforward: all you have to do is tell Trivy what type of element you want to scan. In my case, it’s a Docker image that I’m going to deploy via a yaml definition.
apiVersion:v1kind:Namespacemetadata:labels:trivy-scan:"true"trivy-operator-validation:"false"name:trivytest---apiVersion:v1kind:Podmetadata:name:nginxnamespace:trivytestspec:initContainers:- name:initimage:nginxinc/nginx-unprivileged:latestcommand:['sh','-c','echo The app is running! && sleep 10']containers:- image:nginx:1.18imagePullPolicy:IfNotPresentname:nginx
1
2
3
openshift@sv1-11:24>~ $ oc apply -f trivy-test.yaml
namespace "trivytest" created
pod "nginx" created
what’s happening:
I create a namespace named trivytest
I create a Pod with a nginx image in version 1.18 (which is an old version and therefore ideal for showing vulnerabilities on my Trivy scan report).
Verification:
1
2
3
4
5
6
7
openshift@sv1-12:19>~ $ oc projects | grep trivy
    trivytest
openshift@sv1-12:19>~ $ oc project trivytest
Now using project "trivytest" on server "https://api.crc.testing:6443".
openshift@sv1-12:19>~ $ oc get pods
NAME      READY     STATUS    RESTARTS   AGE
nginx     1/1       Running   0          54m
My namespace and PODS are welled created
I can now reach my route and count the number of vulnerabilities in total or by category: LOW, HIGH, CRITICAL